optimizing

ai

workflows

Overview
Case Study: Designing AI Assistance for Complex Workflows
Building workflows in Alteryx Designer Cloud can be powerful—but for new users, knowing what to do next can be just as challenging as knowing how to use the tools themselves.Points was WW's simplest idea. The experience around it wasn't.

I led the exploration of an interaction model that could predict, suggest, and adapt to user behavior while keeping the user in control. This included defining when AI should intervene, how much confidence it needed to have, how suggestions should appear and disappear, and how actions like accepting, modifying, rejecting, or undoing a suggestion could inform the system over time.

The result was a framework for designing contextual, user-controlled AI assistance within a complex workflow environment.
Problem
Observation
“How do I connect tools?” was among the top 3 questions to our success team.
During
onboarding
sessions
and
usability
tests,
many
users
stopped
after
adding
their
1
first
tool.
  • Only 42% of new users completed a multi-step workflow.
  • Average setup time was 14 minutes for first workflows with drop-off throughout.
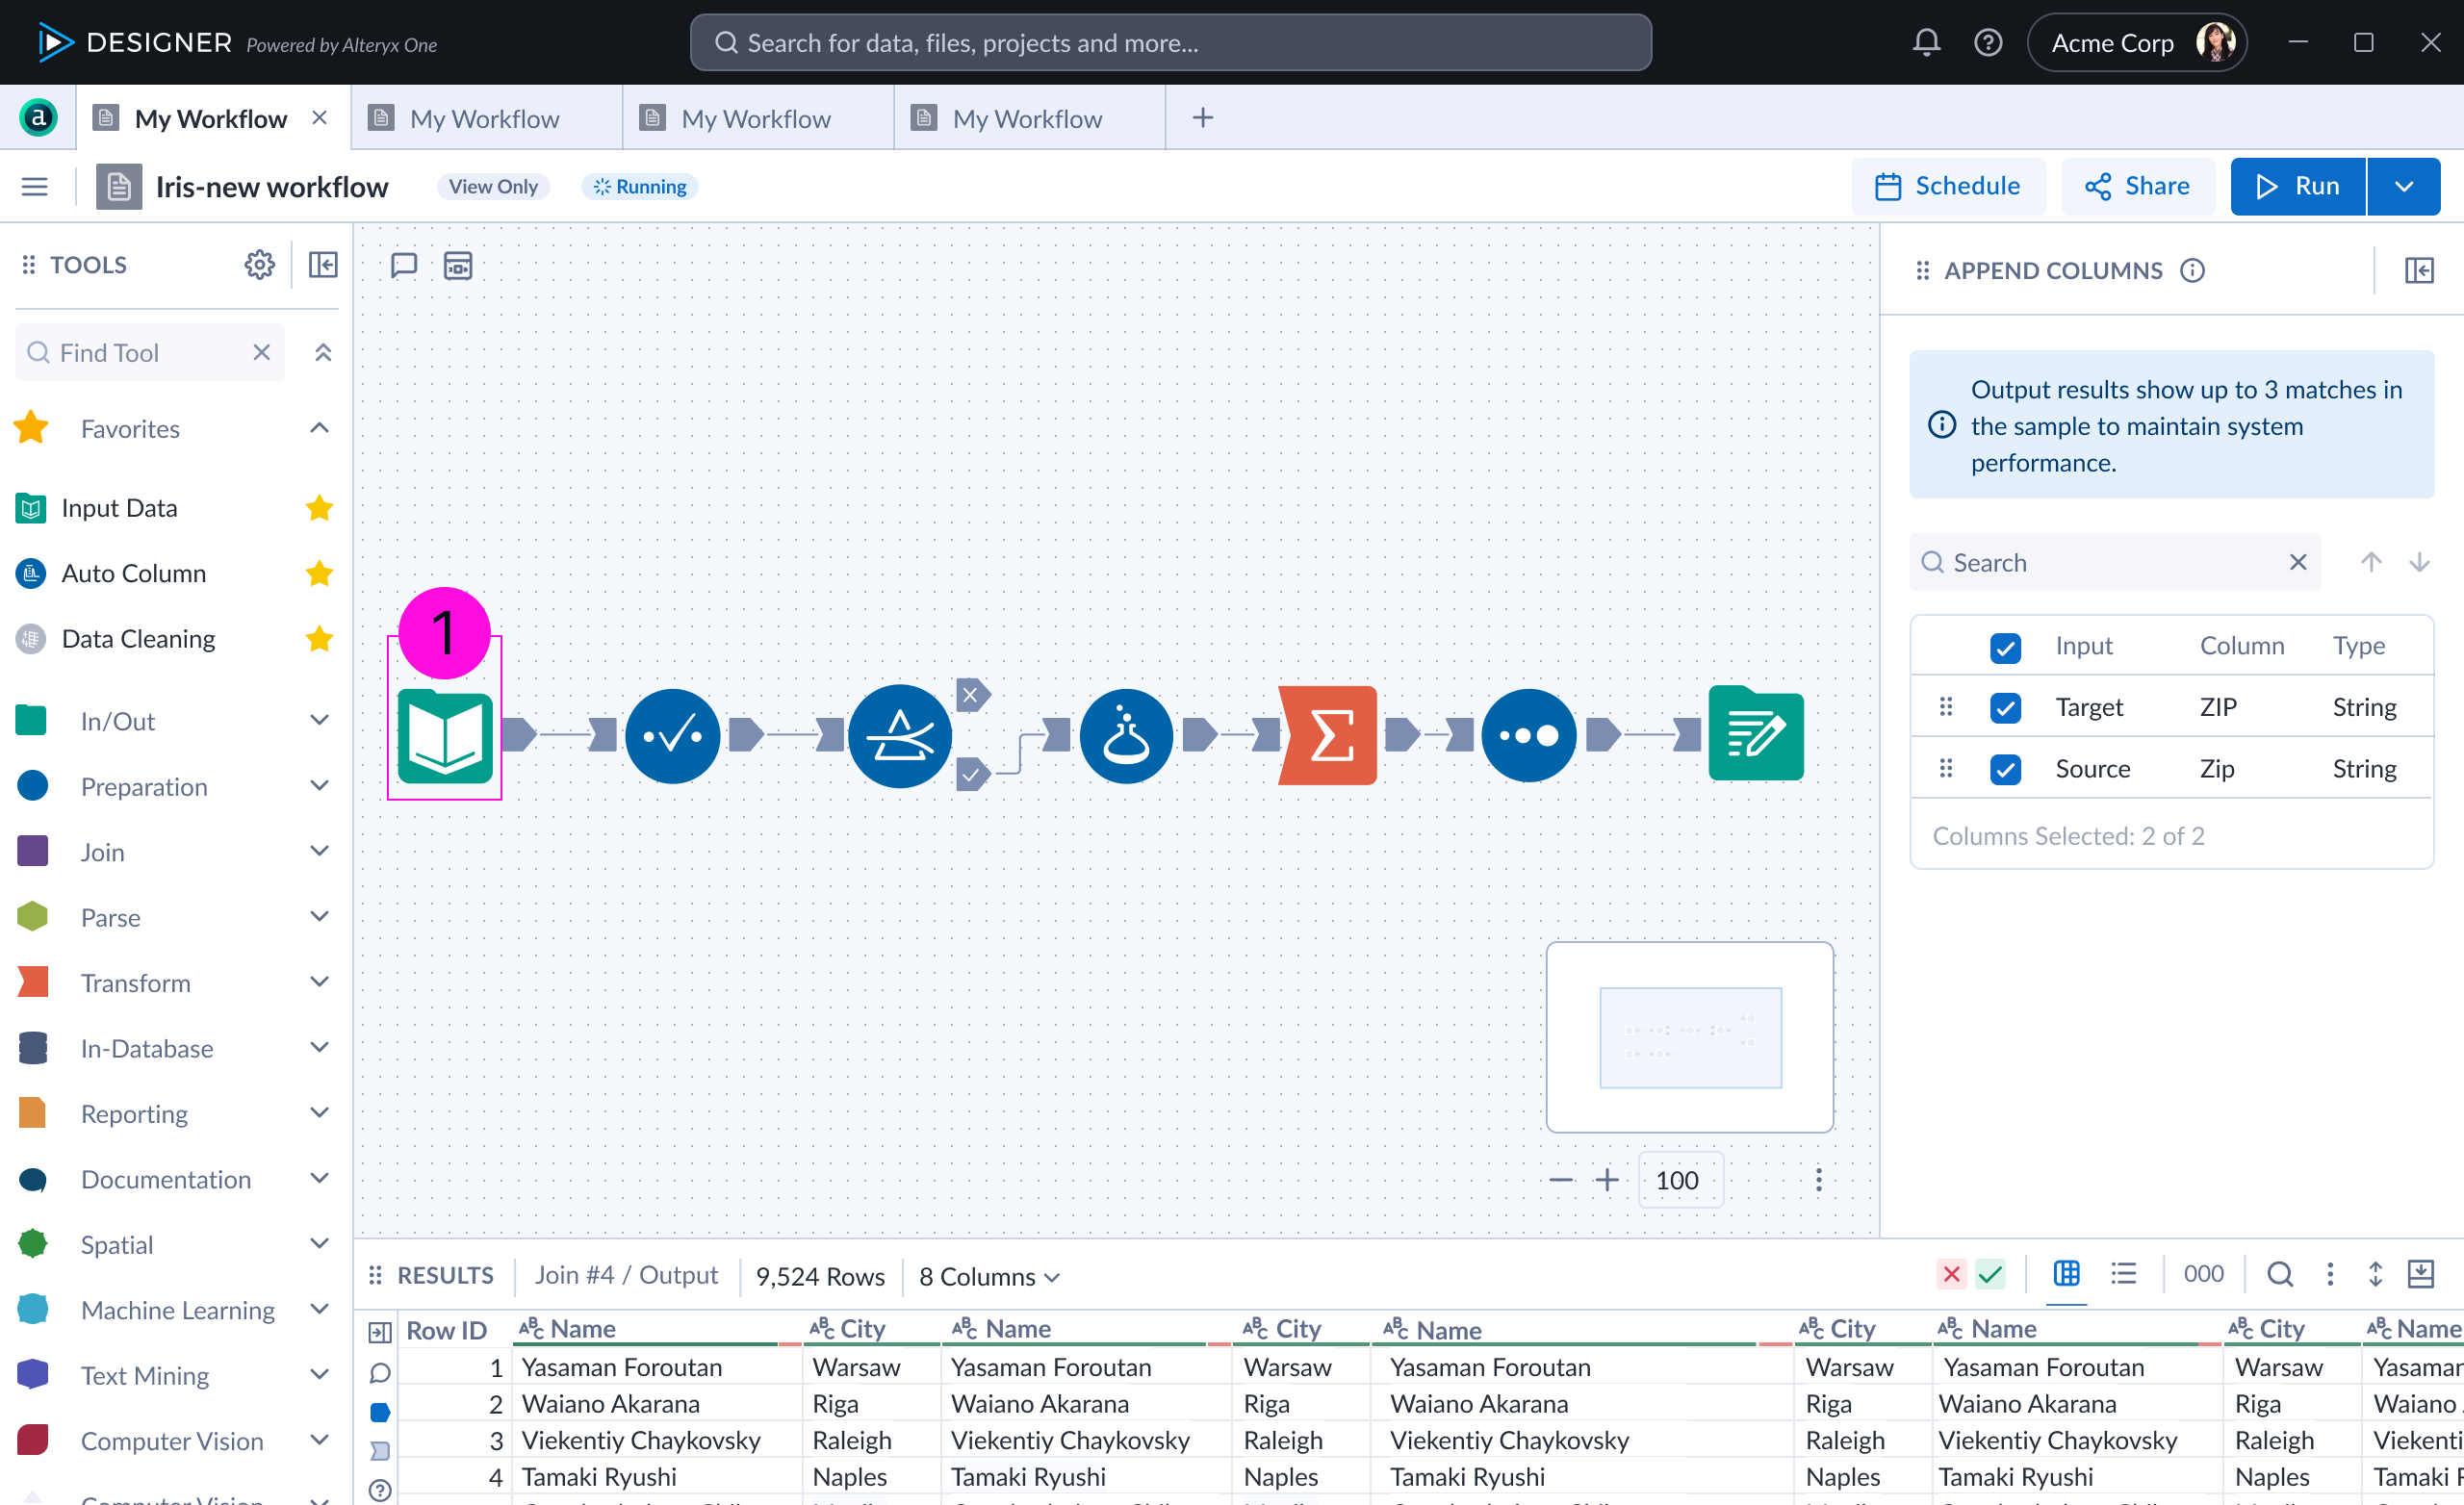
        Understanding Workflows: Building a basic “ingest → clean → output” model
        To understand this work, I've broken down a really common, super simple workflow in Alteryx Designer Cloud and it's real life application. In this workflow, we're looking at an eCommerce analyst creating a clean regional revenue report from raw order data.

        1. Bring in data
        Use a File Input (CSV, Excel) or a Cloud data connection (Snowflake, BigQuery, etc.) Loads last month’s order data from CSV export from Shopify, or Cloud warehouse table. This is usually the starting point—people just want to see their data first.

        Analysts mindset: 'Did the file update correctly?' This step is mostly about sanity checking.
        2. Select / clean columns
        Selecting a tool keeps only the fields you care about (like keeping OrderDate, Region, PriceQuantity, and OrderStatus) and unselecting unnecasary data (product description, fields internal notes). It also creates fix data types (price to decimal, quantity to integer, order date to date).

        Analyst's mindset: 'If I don’t clean the schema now, everything downstream breaks.' This step is preventative maintenance.
        3. Filter rows
        Once given a condition, this tool removes nulls and keeps only certain categories. True output (T) is valid orders, False output (F) is cancelled orders.

        Analyst's mindset: 'Finance only wants fulfilled demand — cancelled orders inflate revenue.' This step shows why visual filtering matters; stakeholders can see what’s excluded and no rows are permanently deleted.
        4. Formulate simple transformations
        Once a new transormation is created: Formula (revenue = price x quantity) + Sort (order rows) + Summarize (group by a field and calculate totals, counts, or averages).

        Analyst mindset: 'Raw data doesn’t answer questions. This step turns data into meaning using business logic.' This step is where definitions live and disagreements get settled ('Is revenue before or after tax?').
        5. Summarize the results
        Once the data is grouped by region, these aggregations show ((Sum(Revenue) = Total Revenue) and ((Count(OrderID) = Number of Orders). Thousands of rows of inputs are summarized into maybe 5–10 regions.

        Analyst mindset: 'This is the actual report.' This step requires no SQL, no pivot tables, and is very hard to mess up.
        6. Sort
        While this step is optional but common, it can help sort columns (total revenue (descending)).

        Analyst mindset: 'Leadership will read this top-down.' This is a small step, big usability win.
        5. Output Data
        Output options can include a CSV emailed to finance, a table written back to Snowflake, or a dataset used by a dashboard.

        Analyst mindset: 'I want this to run again next month with zero changes.' This is the final step in creating an automated revenue report.
        Goal
        Make it easier and faster for users to build meaningful workflows — even without prior experience — by introducing AI-driven tool suggestions that guide them contextually within the canvas.
        Hypothesis
        If we provide context-aware AI suggestions for “what to add next” in a user’s workflow:
        • Users will complete workflows more often and faster (higher activation rate).
        • The cognitive load of exploring the tool library will decrease.
        • Overall user satisfaction and adoption will increase (shorter time to value).
            Process
            1. Understanding Context
            To better understand the problem; I partnered with PMs, researchers, and a Cloud Designer to run a UX Matrix workshop focused on new user pain points. We knew there were multiple fric within the new user journey. My goal was to gain a deep understanding of first-time user friction points and map them by impact and effort to guide design improvements.
            The Designer Cloud Designer and I chunked work for each of us to tackle:
            • Katie: Starting Points, Uploads / Requirements / Workflows, Tools, and Nodes
            • Designer Cloud Designer: Errors, Data Transformations, Columns, Terminology, Credentials, Errors / Data Sampling, Permissions
                  Process
                  2. Define AI-Leverageable Patterns
                  Not all workflow problems are AI problems. Identify which friction points are solvable with prediction, generation, classification, or automation.
                  Our team identified these AI opportunity in workflows and chunked out the work accordingly:
                  • 1. Next-step prediction: Suggesting what tool or action a user is likely to need next.
                    First priority
                  • 2. Automated setup: Pre-filling forms, generating starter templates, auto-configuring complex settings.
                  • 3. Contextual summarization: Reducing the need to navigate multiple views or artifacts.
                  • 4. Error prevention: Detecting anomalies or misconfigurations before they occur.
                          3. Concept Exploration
                          We explored three directions:
                          • Task Given
                          • Current UI
                          • Proposed UI
                          • Results observed
                          • 1. Find Points left today (time to complete)
                          • 3.6s avg
                          • 3.1s avg
                          • Reskin did not disrupt points comprehension (success)
                          • 2. Correctly distinguish Daily vs. Weekly Points (comprehension quiz)
                          • 88% correct
                          • 88% correct
                          • Reskin did not disrupt points comprehension (success)
                          • 3. Navigate to a recipe from My Day
                          • 3.4 taps avg
                          • 2.1 taps avg
                          • Reskin reduced friction
                          • 4. Self-reported confidence in tracking accuracy
                          • 3.2 / 5
                          • 3.9 / 5
                          • Modest improvement
                          • 5. App opens per day (behavioral, not task-based)
                          • 2.1
                          • 1.7
                          • Unexpected drop due to widget integration
                          • 6. "This feels harder to use than before" (existing users only, open text)
                          • —
                          • 14% of Group B
                          • Minority friction from users with old muscle memory
                          4. Ghost Tool Interaction Model
                          Ghost tools should never feel random. We chunked work into 10 vital steps: User Intent & Trigger Context, Scope & Boundaries, Visibility Model, Control & Agency, Feedback & Learning Loop, Error Prevention & Risk Signaling, Mental Model Alignment, Lifecycle on the Canvas, Performance & System Constraints, and Success Metrics.
                          4a. User Intent & Trigger Context (the “why did this happen?” layer)
                          Define details:
                          Trigger conditions
                          User action identified (dragging a dataset, connecting nodes, running a query)
                          User goal assumption
                          User is trying to join two datasets.
                          Confidence level
                          - Medium → suggest
                          - Low → stay silent
                          Example:
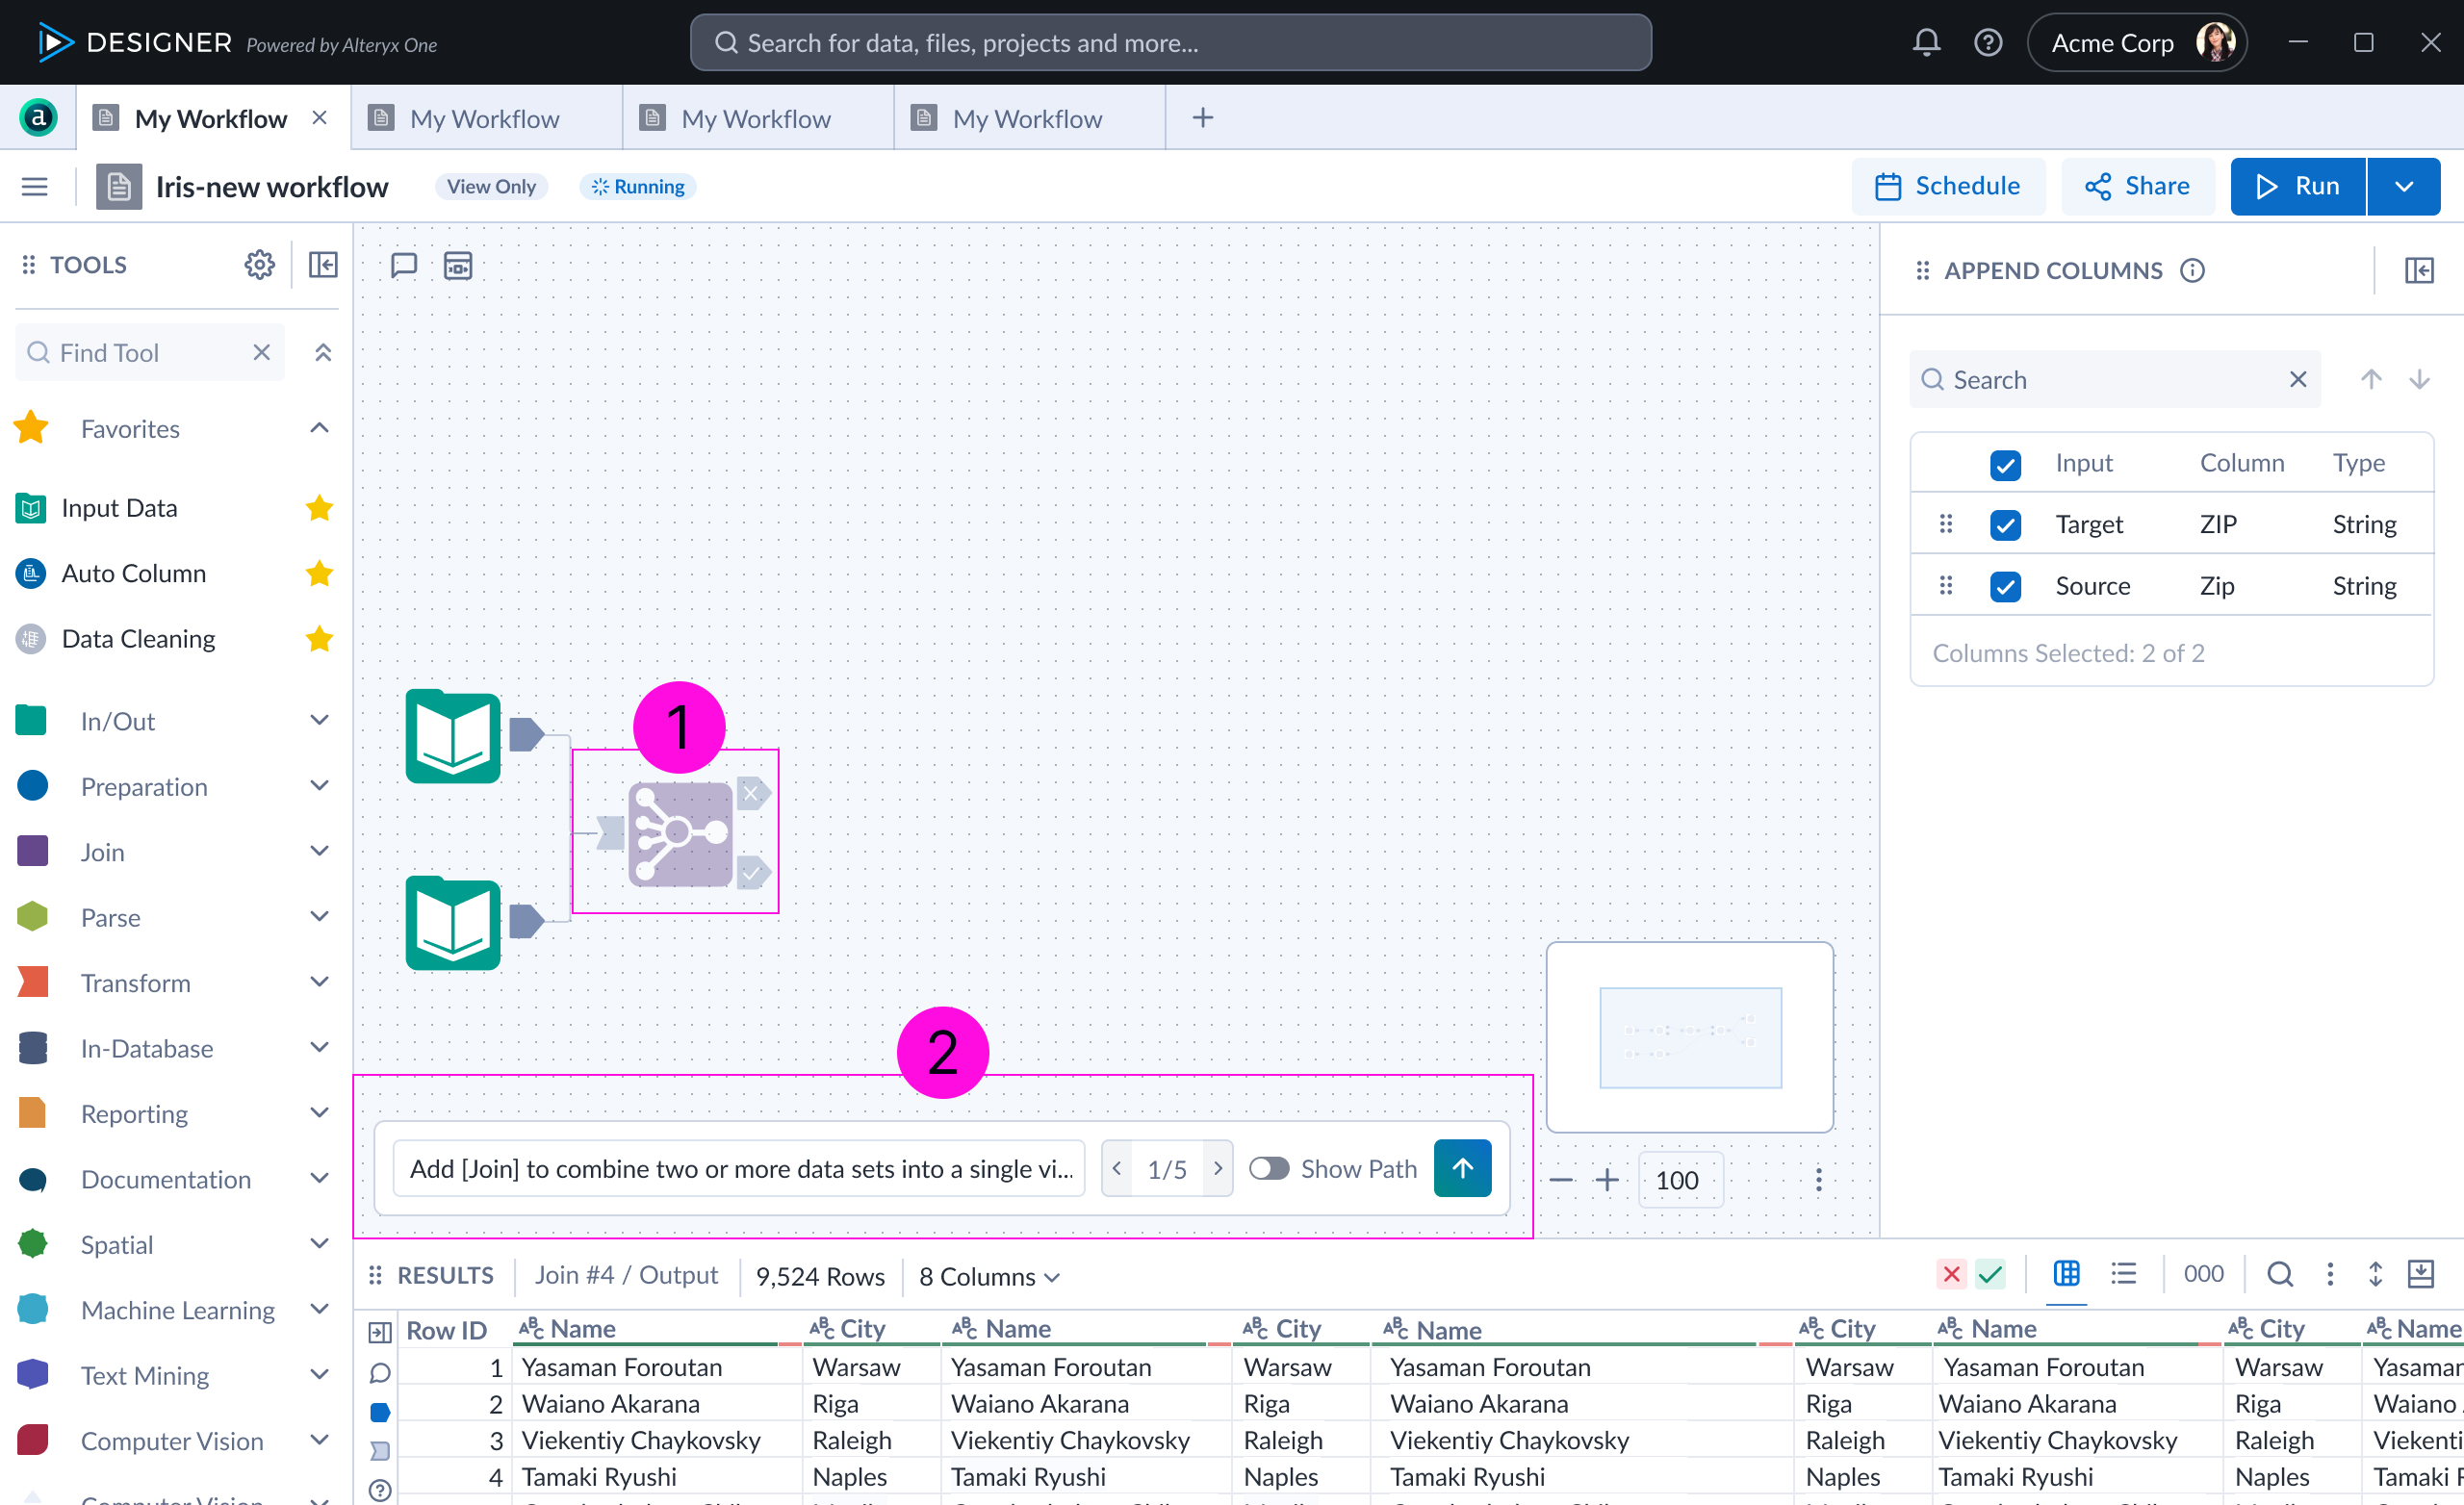
                          User
                          drops
                          a
                          second
                          dataset
                          onto
                          the
                          canvas
                          →
                          ghost
                          tool
                          infers
                          a
                          1
                          join
                          tool.
                          The
                          2
                          AI
                          navigation
                          dialogue
                          options.
                          4b. Scope & Boundaries (ghost tools vs ghost path)
                          Design Details:
                          Local vs global impact
                          Our model builds by localized steps, rather than total ecosystem level.
                          Multipule workflow options
                          Workflows aren't one size fits all — users can toggle between ghost tool options and undo easily when they've made a mistake.
                          Example:
                          User
                          accepts
                          ghost
                          tool
                          suggestion
                          but
                          wants
                          to
                          see
                          the
                          whole
                          3
                          ghost
                          path.
                          4c. Visibility Model (how “ghosty” is it?)
                          Design details:
                          Visual affordances
                          4
                          Faint
                          connections
                          5
                          Faint
                          tool
                          image
                          6
                          Faint
                          nodes
                          7
                          AI
                          navigation
                          dialogue
                          Temporal visibility
                          Appears only when AI model is running, otherwise off
                          Explainability affordance
                          'Why
                          this
                          happened'
                          8
                          helper
                          alert
                          in
                          configuration
                          panel.
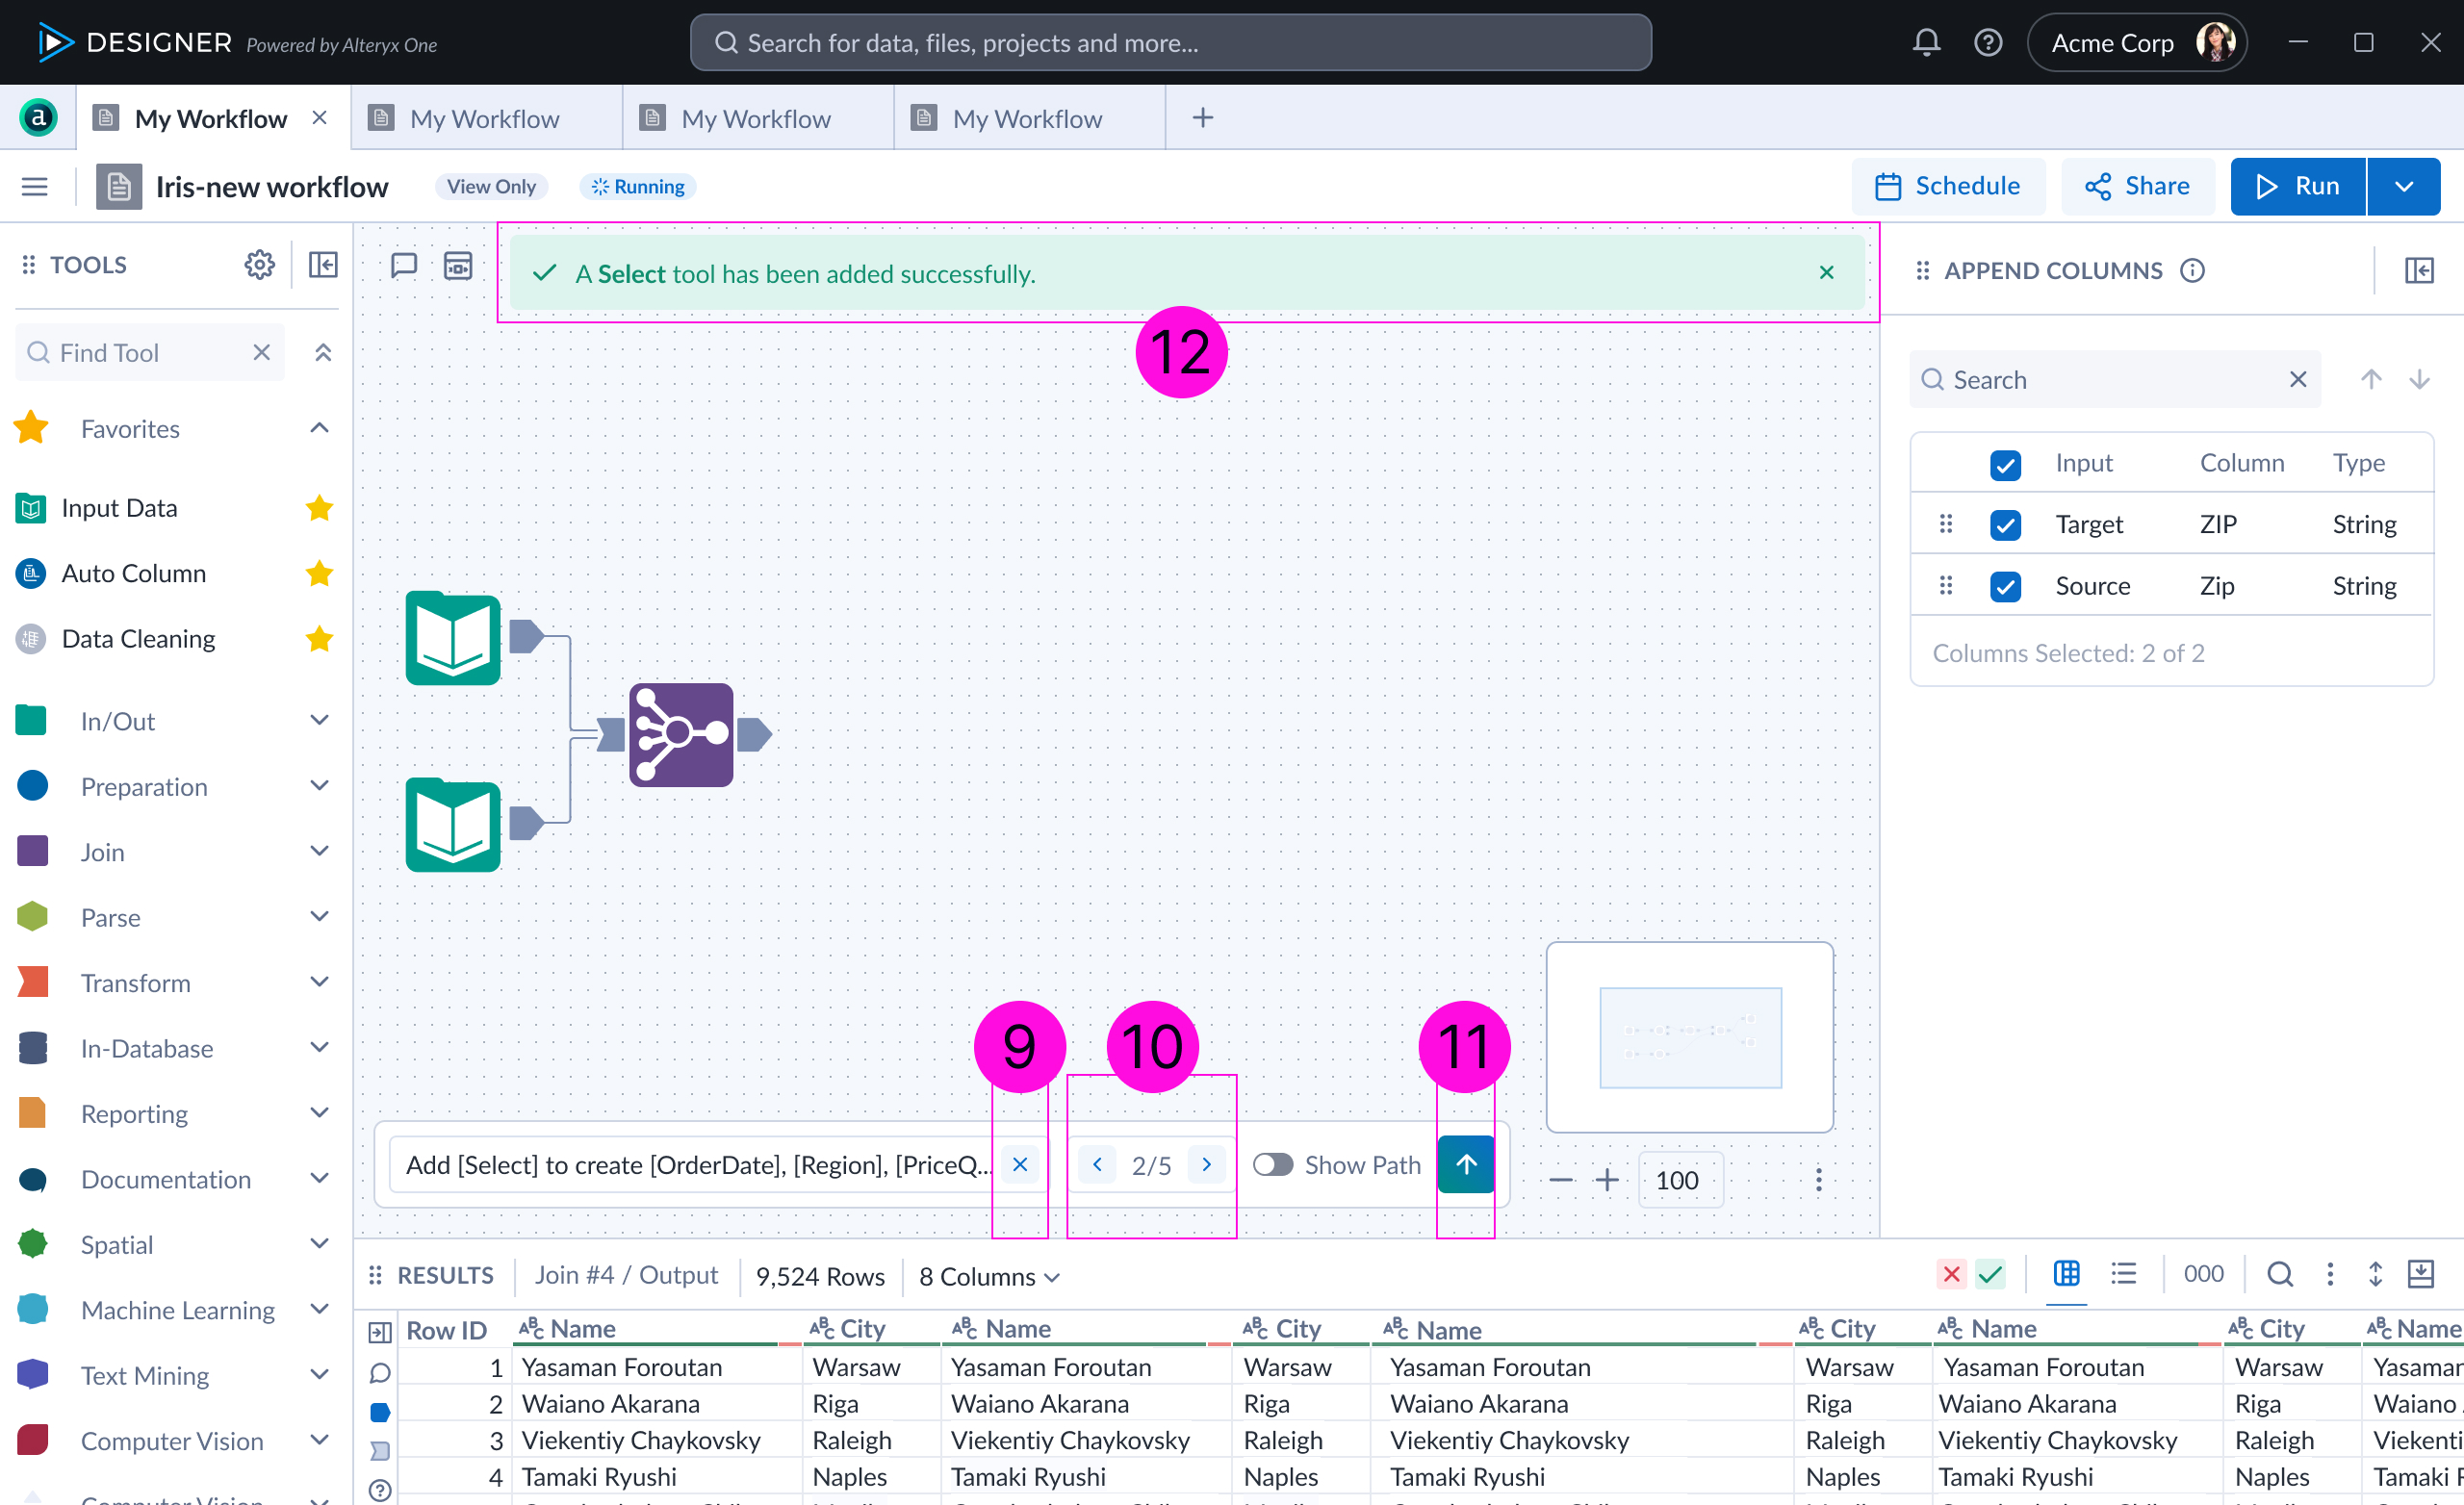
                          4d. Control & Agency (user stays in charge). Never let automation feel bossy.
                          Design Details:
                          9
                          Dismiss,
                          10
                          next
                          /
                          previous
                          11
                          accept
                          actions.
                          12
                          'Status
                          alert'
                          (success,
                          warning,
                          info,
                          error)
                          appears
                          for
                          5
                          seconds.
                          Dismiss
                          option
                          callibrates
                          model.
                          4e. Feedback & Learning Loop (system gets smarter)
                          Design details:
                          Ghost path matures based off feedback signals
                          - Accepted
                          - Modified
                          - Rejected
                          Implicit signals
                          - User immediately undoes action
                          Example:
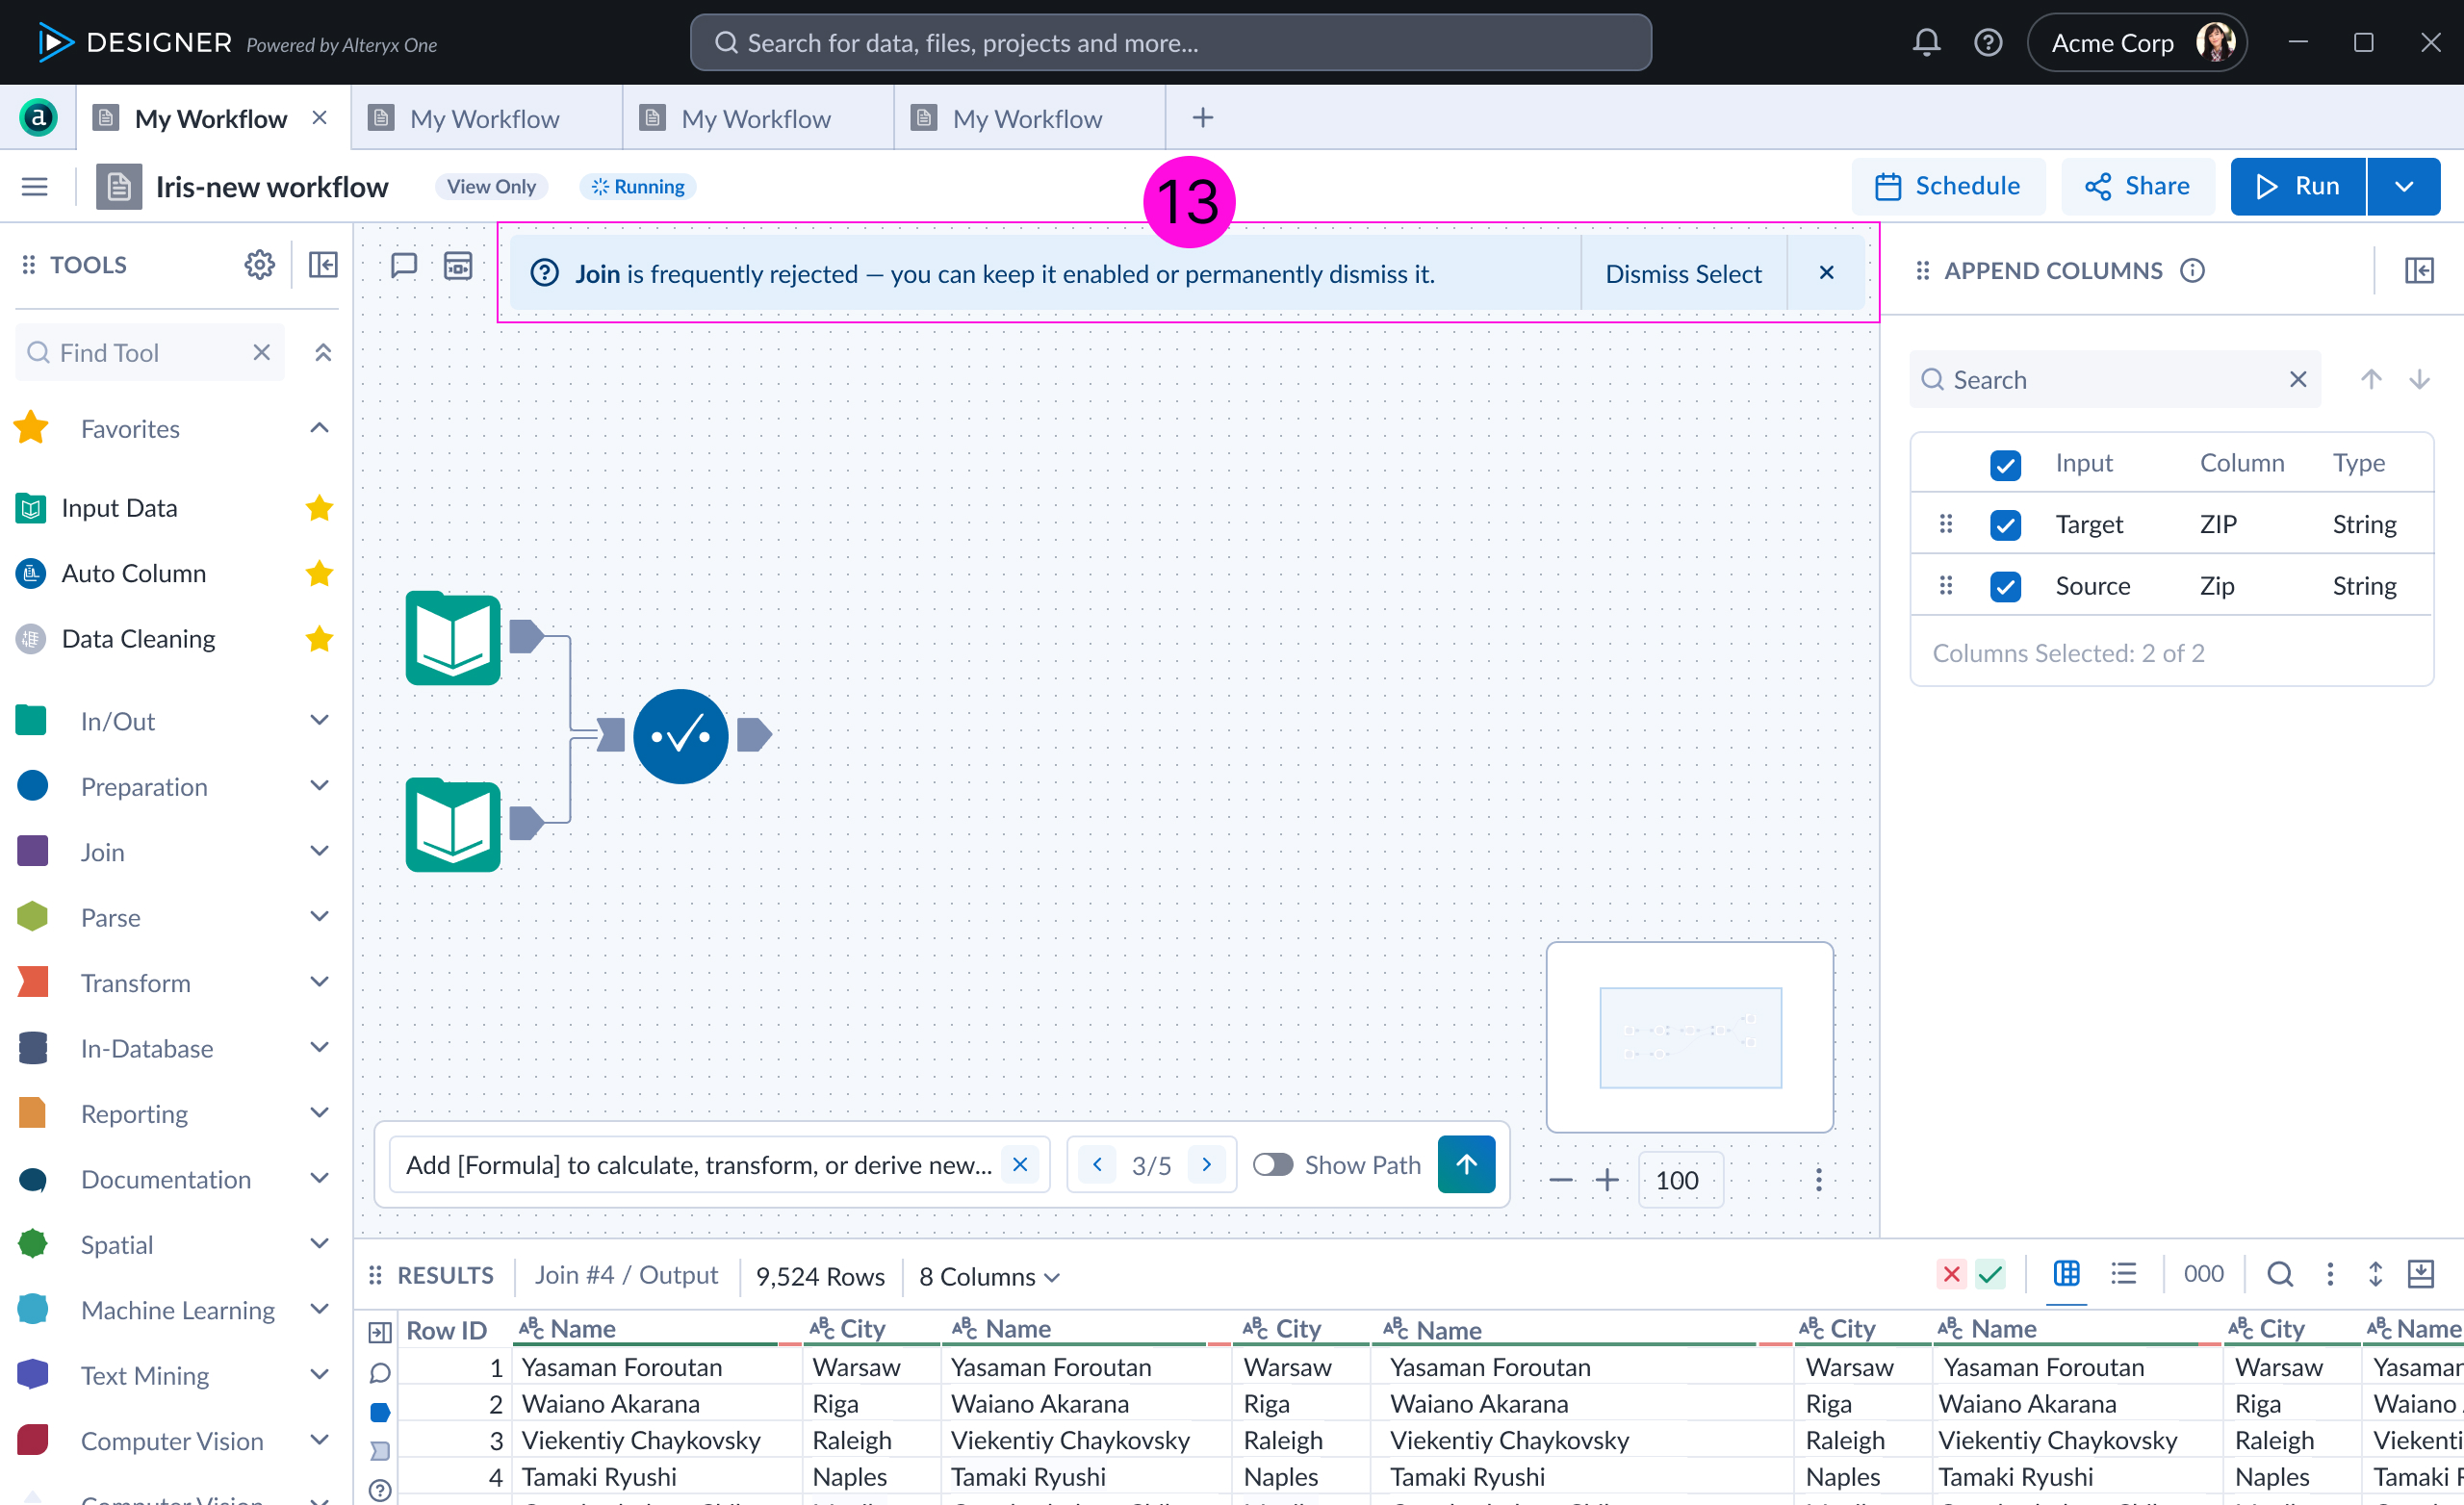
                          User
                          repeatedly
                          13
                          declines
                          auto-generated
                          joins
                          →
                          system
                          downgrades
                          future
                          join
                          suggestions.
                          4f. Error Prevention & Risk Signaling
                          Design details:
                          Confidence warnings
                          “Multiple join keys detected”
                          Example:
                          A
                          14
                          helper
                          alert
                          in
                          the
                          configuration
                          panel
                          flags
                          low
                          confidence.
                          4g. Bridging the Gap in Lifecycle on the Canvas
                          Design details:
                          Birth
                          - AI model is visible on default for first time users / genesis state.
                          Existence
                          - User interacts with AI model to build ghost tools or ghost path.
                          Death
                          - Workflow is completed; user defines steps manually.
                          Example:
                          If
                          user
                          continues
                          workflow
                          manually
                          →
                          convert
                          to
                          15
                          placeholder
                          text.
                          4h. Performance & System Constraints (the unsexy but vital part)
                          Design details:
                          - Latency thresholds (must feel instant)
                          - Offline / partial data behavior
                          Example:
                          Ghost
                          path
                          16
                          disabled
                          during
                          long-running
                          queries.
                          5. Collaboration with Engineering
                          Partnering with engineering, we identified what limitations our AI model has based on:
                          • Ensuring responsive workflows that don’t slow down users in the Designer Cloud UI.
                          • Comply with data protection regulations (e.g., GDPR, CCPA).
                            • Protect AI endpoints from misuse (e.g., dependencies or unauthorized access).
                                    Outcomes
                                    Success Metrics (expected after beta)
                                    • Increase in workflow completion rate.
                                    • Reduction in average time to first successful workflow.
                                    • NPS from users who used AI suggestions.
                                        Takeways
                                        Impact on Product Strategy
                                        Based off this feature, new qustions have been raised reguarding:
                                        • Versioning and tracking models as they evolve.
                                        • Monitoring drift — models can degrade as business conditions change.
                                        • Managing compute costs (e.g., GPU/CPU hours).
                                        • Handling concurrent requests when multiple users leverage AI features.
                                            Reflection
                                            Implementing AI in Alteryx Designer Cloud isn’t just about “adding a model.” You’re effectively augmenting a cloud analytics platform with distributed compute, model orchestration, secure data pipelines, governance tracking, and a responsive end‑user experience — all while managing costs and maintaining trust in the outputs.